
😘 Kiss bugs goodbye with fully automated end-to-end test coverage (Sponsored)
Bugs sneak out when less than 80% of user flows are tested before shipping. However, getting that kind of coverage (and staying there) is hard and pricey for any team. QA Wolf’s AI-native service provides high-volume, high-speed test coverage for web and mobile apps, reducing your organization’s QA cycle to less than 15 minutes. They can get you:
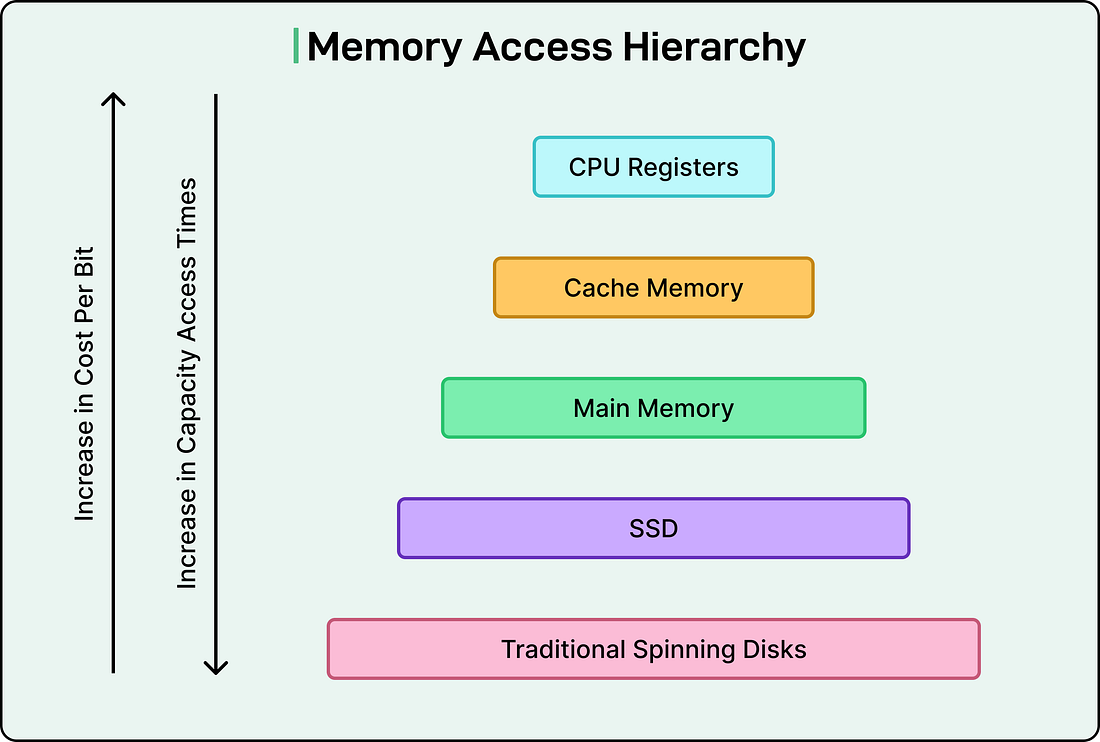
Engineering teams move faster, releases stay on track, and testing happens automatically—so developers can focus on building, not debugging. Drata’s team of 80+ engineers achieved 4x more test cases and 86% faster QA cycles. ⭐ Rated 4.8/5 on G2. We’ve all been there. Our code works perfectly, passes all tests, and does exactly what it’s supposed to do. Then we deploy it to production and realize it takes 10 seconds to load a page when users expect instant results. Or worse, it works fine with test data but crawls to a halt with real-world volumes. The common reaction is to think about optimizing later, or leaving performance tuning for experts. Both assumptions are wrong. The truth is that writing reasonably fast code doesn’t require advanced computer science knowledge or years of experience. It requires developing an intuition about where performance matters and learning some fundamental principles. Many developers have heard the famous quote about premature optimization being “the root of all evil.” However, this quote from Donald Knuth is almost always taken out of context. The full statement reads: “We should forget about small efficiencies, say about 97% of the time: premature optimization is the root of all evil. Yet we should not pass up our opportunities in that critical 3%”. This article is about that critical 3%, where we’ll explore how to estimate performance impact, when to measure, what to look for, and practical techniques that work across different programming languages. Learning to EstimateOne of the most valuable skills in performance-aware development is the ability to estimate rough performance costs before writing code. We don’t need precise measurements at this stage, but we just need to understand orders of magnitude. Think of computer operations as existing in different speed tiers. At the fastest tier, we have CPU cache access, which happens in nanoseconds. These are operations where the data is already sitting right next to the processor, ready to be used. One tier slower is accessing main memory (RAM), which takes roughly 100 times longer than cache access. Moving down the hierarchy, reading from an SSD might take 40,000 times longer than a cache access. Network operations take even longer, and traditional spinning disk seeks can be millions of times slower than working with cached data.
This matters because for designing a system that needs to process a million records, the architecture should look completely different depending on whether that data comes from memory, disk, or a network call. A simple back-of-the-envelope calculation can tell us whether a proposed solution will take seconds, minutes, or hours. Here’s a practical example. Suppose we need to process one million user records. If each record requires a network call to a database, and each call takes 50 milliseconds, we’re looking at 50 million milliseconds, or about 14 hours. However, if we can batch those requests and fetch 1000 records per call, suddenly we only need 1000 calls, which takes about 50 seconds. Measure Before We OptimizeOur intuition about performance bottlenecks is usually wrong. We might spend days optimizing a function we think is slow, only to discover through profiling that some completely different part of the code is the actual problem. This is why the main rule of performance optimization is to measure first and optimize second. Modern programming languages and platforms provide excellent profiling tools that show us exactly where our program spends its time. These tools track CPU usage, memory allocations, I/O operations, and lock contention in multi-threaded programs. The basic profiling approach is straightforward.
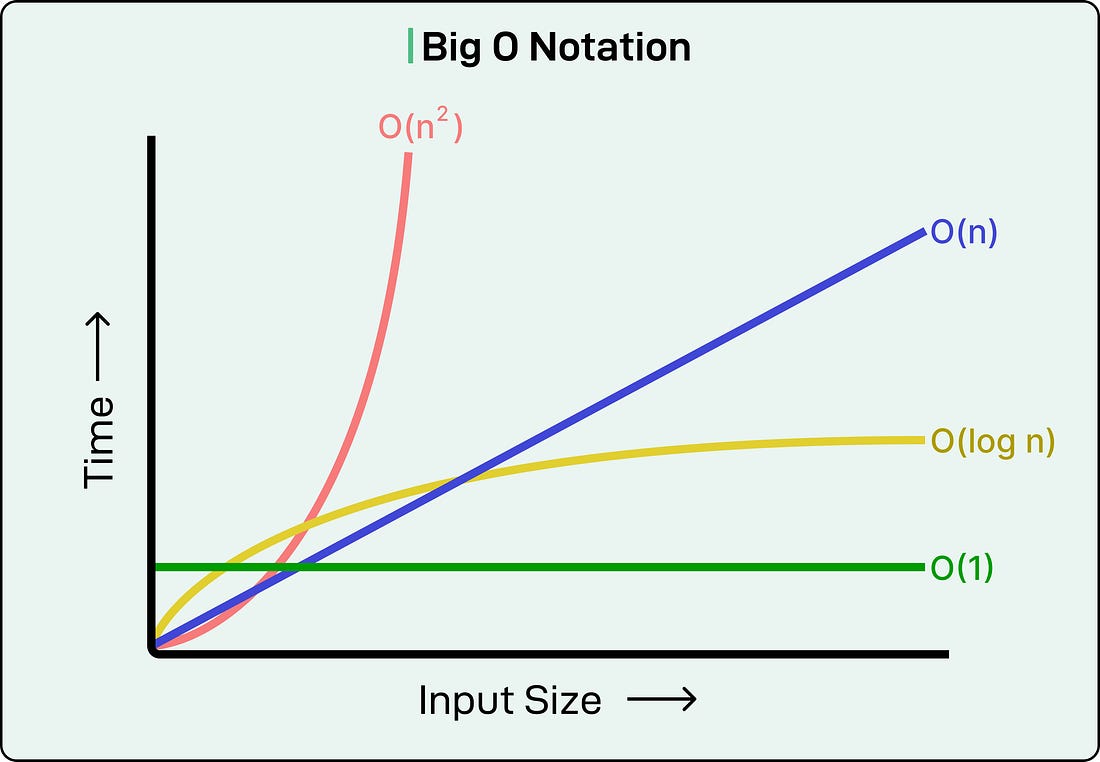
The key point is that we should let data guide our optimization decisions. Algorithmic WinsThe most important performance improvements almost always come from choosing better algorithms and data structures. A better algorithm can provide a 10x or 100x speedup, dwarfing any micro-optimization we make. Consider a common scenario: we have two lists and need to find which items from the first list exist in the second. The naive approach uses nested loops. For each item in list A, we scan through all of list B looking for a match. If each list has 1000 items, that’s potentially one million comparisons. This is an O(N²) algorithm, meaning the work grows with the square of the input size.
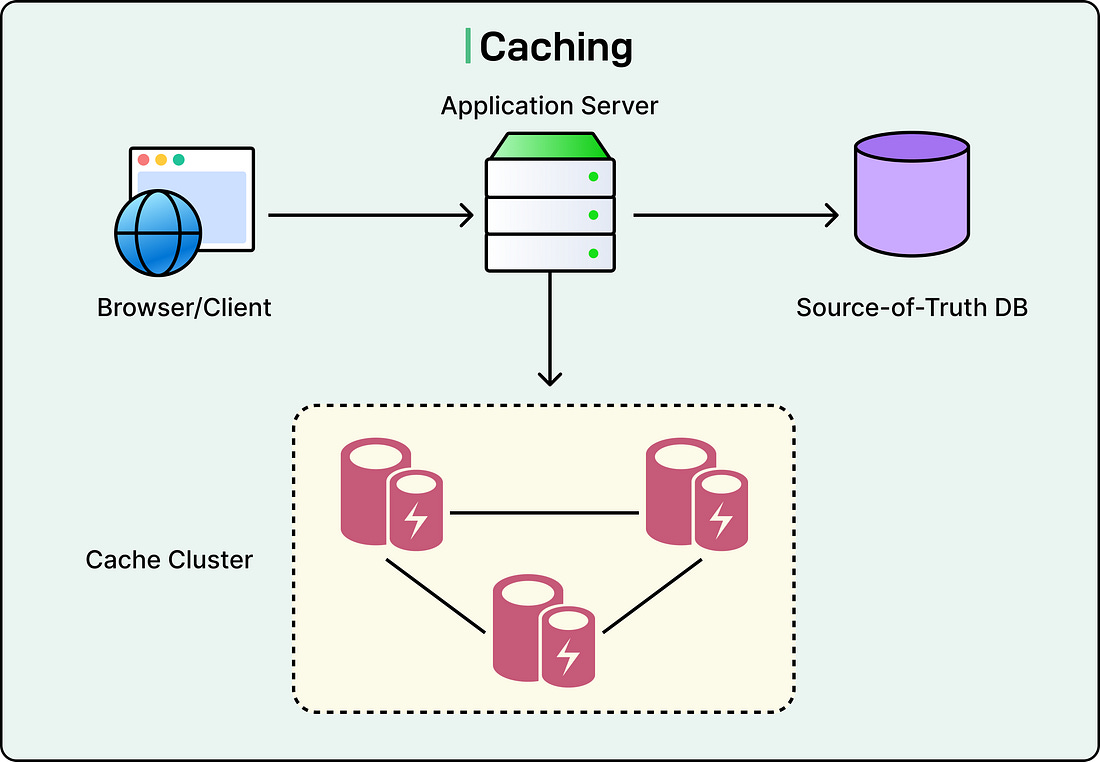
A better approach converts list B into a hash table, then looks up each item from list A. Hash table lookups are typically O(1), constant time, so now we’re doing 1000 lookups instead of a million comparisons. The total work is O(N) instead of O(N²). For our 1000-item lists, this could mean finishing in milliseconds instead of seconds. Another common algorithmic improvement involves caching or precomputation. If we’re calculating the same value repeatedly, especially inside a loop, we should calculate it once and store the result.
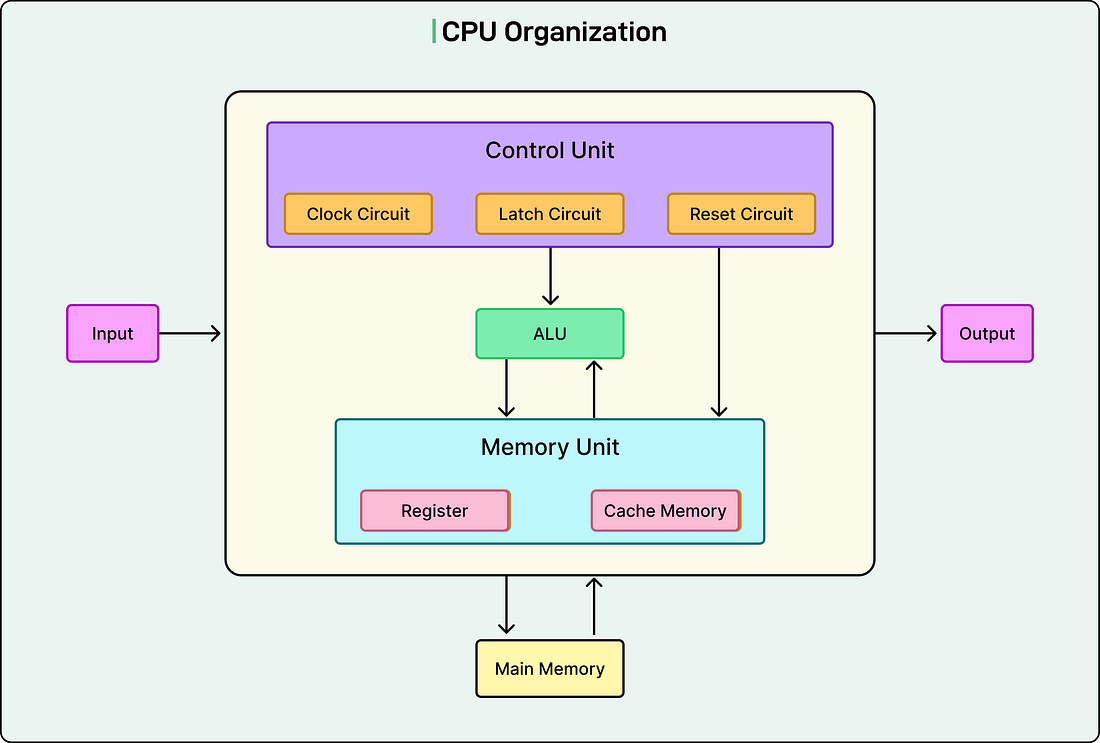
The key to spotting algorithmic problems in a profile is looking for functions that consume most of the runtime and contain nested loops, or that repeatedly search or sort the same data. Before we dive into optimizing such code, we should step back and ask if there is a fundamentally different approach that does less work? Memory MattersModern CPUs are incredibly fast, but they can only work on data that’s in their small, ultra-fast caches. When the data they need isn’t in cache, they have to fetch it from main memory, which is much slower. This difference is so significant that the layout of our data in memory often matters more than the algorithmic complexity of our code. See the diagram below:
The fundamental principle here is locality: data that is accessed together should be stored together in memory. When the CPU fetches data from memory, it doesn’t fetch just one byte. It fetches an entire cache line, typically 64 bytes. If our related data is scattered across memory, we waste cache lines and constantly fetch new data. If it’s packed together, we get multiple pieces of related data in each cache line. Consider two ways to store a list of user records:
The first approach means that accessing each user requires chasing a pointer, and each user object might be on a different cache line. The second approach means that once we fetch the first user, the next several users are likely already in cache. This is why arrays and vectors typically outperform linked lists for most operations, even though linked lists have theoretical advantages for insertions and deletions. The cache efficiency of sequential access usually dominates. Reducing the memory footprint also helps. Smaller data structures mean more fit in cache. If we’re using a 64-bit integer to store values that never exceed 255, we’re wasting memory. Using an 8-bit type instead means we can fit eight times as many values in the same cache line. Similarly, removing unnecessary fields from frequently accessed objects can have a measurable impact. The access pattern matters too. Sequential access through an array is much faster than random access. If we’re summing a million numbers stored in an array, it’s fast because we access them sequentially and the CPU can predict what we’ll need next. If those same numbers are in a linked list, each access requires chasing a pointer to an unpredictable location, destroying cache efficiency. The practical takeaway is to prefer contiguous storage (arrays, vectors) over scattered storage (linked lists, maps) when performance matters. Keep related data together, and access it sequentially when possible. Reduce AllocationsEvery time we allocate memory, there’s a cost. The memory allocator has to find available space, bookkeeping data structures need updating, and the new object typically needs initialization. Later, when we’re done with the object, it needs cleanup or destruction. In garbage-collected languages, the collector has to track these objects and eventually reclaim them, which can cause noticeable pauses. Beyond the allocator overhead, each allocation typically ends up on a different cache line. If we’re creating many small objects independently, they’ll be scattered across memory, hurting cache efficiency as discussed in the previous section. Common sources of excessive allocation include creating temporary objects inside loops, repeatedly resizing containers as we add elements, and copying data when we could move it or just reference it. Container pre-sizing is an effective technique. If we know we’ll eventually need a vector with 1000 elements, we should reserve that space upfront. Otherwise, the vector might allocate space for 10 elements, then 20, then 40, and so on as we add elements, copying all existing data each time. Reusing objects is another straightforward win. If we’re creating and destroying the same type of temporary object thousands of times in a loop, we should create it once before the loop and reuse it on each iteration, clearing it as needed. This is especially important for complex objects like strings, collections, or protocol buffers. Modern languages support “moving” data instead of copying it. Moving transfers ownership of the data without duplicating it. When we’re passing large objects between functions and don’t need to keep the original, moving is much cheaper than copying. Different container types have different allocation characteristics. Maps and sets typically allocate memory for each element individually. Vectors and arrays are allocated in bulk. When performance matters, and we’re choosing between containers with similar capabilities, the allocation pattern can be the deciding factor. Avoid Unnecessary WorkThe fastest code is code that never runs. Before we optimize how we do something, we should ask whether we need to do it at all or whether we can do it less frequently. Some common strategies for the same are as follows:
Practical Tips for Everyday CodingSome performance considerations should become second nature as we write code, even before we profile.
Knowing When to StopNot all code needs optimization. We shouldn’t optimize everything, just the parts that matter. The famous Pareto principle applies here: roughly 20% of our code typically accounts for 80% of the runtime. Our job is to identify and optimize that critical 20%. Performance isn’t the only concern. Code readability also matters because other developers need to maintain our code. Overly optimized code can be difficult to understand and modify. Developer time has value, too. Spending a week optimizing code that saves one second per day might not be worthwhile. The right approach is to write clear, correct code first. Then we should measure to find real bottlenecks, followed by optimizing the critical paths until we hit our performance targets. At that point, we stop. Additional optimization has diminishing returns and increasing costs in terms of code complexity. That said, some situations clearly demand performance attention. Code that runs millions of times, like functions in the hot path of request handling, deserves optimization. User-facing operations should feel instant because perceived performance affects user satisfaction. Background processing at scale can consume enormous resources if inefficient, directly impacting operational costs. Resource-constrained environments like mobile devices or embedded systems need careful optimization to function well. ConclusionWriting fast code requires developing intuition about where performance matters and learning fundamental principles that apply across languages and platforms. The journey starts with estimation. Understanding the rough costs of common operations helps us make smart architectural decisions before writing code. Measurement shows us where the real problems are, often surprising us by revealing bottlenecks we never suspected. Better algorithms and data structures provide order-of-magnitude improvements that dwarf micro-optimizations. Memory layout and allocation patterns matter more than many developers realize. And often, the easiest performance win is simply avoiding unnecessary work. The mindset shift is from treating performance as something we fix later to something we consider throughout development. We don’t need to obsess over every line of code, but we should develop awareness of the performance implications of our choices.
|
How to Write High-Performance Code
Wednesday, 28 January 2026

Subscribe to:
Post Comments (Atom)


No comments:
Post a Comment